
Cloud Native Observability: A Practical Engineering Guide
September 29, 2026•CloudCops
Installing another monitoring agent won't fix cloud native observability. It may give you more dashboards, more streams of telemetry, and more alerts, while engineers still jump between tools to answer a basic production question: what changed, which requests are affected, and where did the failure begin?
The hard problem isn't collection. Kubernetes can expose metrics, applications can emit logs, and OpenTelemetry can transport signals across environments. The hard problem is operational fragmentation, weak correlation, and uncontrolled retention. A useful observability practice connects telemetry to user impact, gives the on-call engineer actionable context, and treats every stored signal as a cost and reliability decision.
The Reality of Cloud Native Observability
Cloud native observability fails when teams treat it as a telemetry collection project. Kubernetes can produce more metrics, logs, traces, and events than an on-call engineer can use. The production test is narrower: can the engineer connect a customer-visible symptom to the responsible service, recent change, and failure point before alert fatigue and tool switching slow the response?
Traditional monitoring starts with known conditions. A host is down, a process has stopped, or a threshold has been crossed. Kubernetes changes that operating environment. Pods are replaced, services scale dynamically, containers move between nodes, and one request may pass through many independently deployed components. A signal can outlive the workload that produced it, so its value depends on retained context such as deployment, namespace, service, and request metadata.
Observability supports investigation when the failure is not yet known. Engineers combine metrics, logs, traces, cluster events, and change data to reconstruct what happened. Collection is only the first step. Correlation, ownership, retention, and alert design determine whether that data helps during an incident or becomes another source of noise.
The adoption history explains why a single-tool mindset is inadequate. A 2021 CNCF observability microsurvey found that Prometheus was used by 86% of respondents' organizations for event monitoring and alerting, while OpenTelemetry was used by 49% and Fluentd by 46%. The results show an ecosystem built around specialized open-source components, with metrics often serving as the entry point.
More telemetry isn't the same as more understanding
Modern teams have more tooling choices, but integration work remains. A 2026 industry survey reported that 65% of organizations invested in both Prometheus and OpenTelemetry. Prometheus had 77% overall investment and OpenTelemetry 76%, pointing to a dual-standard stack rather than a winner-takes-all market.
The same survey found OpenTelemetry used for metrics by 57% of respondents, traces by 50%, and logs by 48%. A 2026 CNCF analysis reported that 46.7% of organizations still run two to three observability tools in parallel, while only 7.4% have a single unified experience. Dashboard and alert configuration was the biggest setup challenge for 54% of respondents.
Practical rule: Design the investigation path before choosing the backend. If an engineer cannot move from an impact signal to the responsible service, the stack is collecting data rather than delivering observability.
The right mental model is an operational system. Instrumentation must emit consistent context, collectors must process and route signals, storage must fit query needs, and alerts must represent service impact. Teams can keep specialized tools, but they need clear ownership and interfaces between them. That discipline reduces fragmentation without asking engineers to search every system during an incident.
Understanding the Four Telemetry Signals
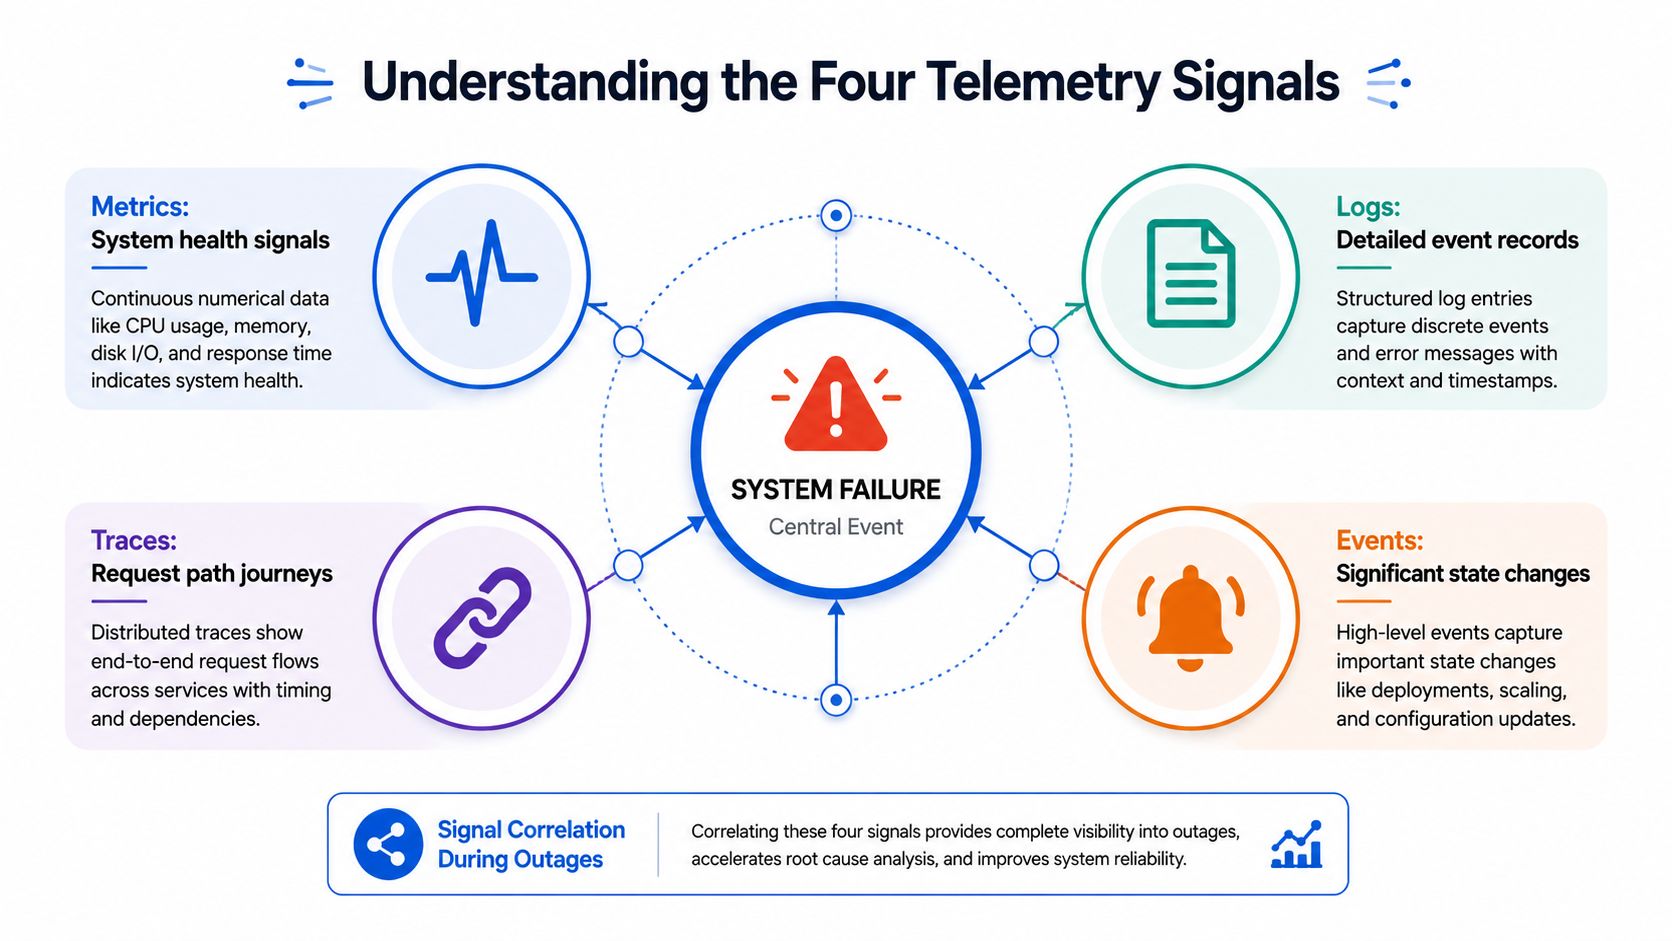
A memory leak in a Kubernetes pod shows why the four signals work as a system. Treating them as separate products leaves the incident narrative scattered across dashboards and log search screens.
Start with metrics
The first indication may be a rising memory working set, increasing restart activity, or growing request latency. Metrics provide the compact view that makes an abnormal pattern visible across a deployment. They answer questions such as whether the issue affects one pod, one service, or a broader cluster segment.
A metric alone rarely explains the cause. It tells you that the service is degrading and helps establish when the degradation started. From there, the engineer needs request context and workload history.
Follow the trace
A distributed trace maps a request through the services it calls. If the affected API begins timing out while calling a recommendation service, payment component, or database adapter, the trace shows where time accumulates and which downstream span fails.
Trace context must travel across service boundaries. Consistent propagation lets an engineer select a slow request and inspect the same request's downstream work instead of searching unrelated records.
Use structured logs for detail
Logs supply the detailed explanation that metrics and traces often lack. A structured error can identify an allocation failure, rejected dependency response, or retry storm. Each application log should carry trace and span identifiers where possible, along with service, namespace, pod, and deployment metadata.
That structure matters more than verbose messages. A free-text line saying an operation failed forces manual interpretation. A structured record with stable fields supports filtering, aggregation, and direct navigation from a trace.
Treat events as state changes
Kubernetes events complete the timeline. A rescheduling action, failed probe, rollout, eviction, or autoscaling decision can explain why the application signal changed. Events don't replace metrics or logs, but they often identify the platform action that turned a local fault into a wider incident.
A useful failure workflow looks like this:
- Metrics identify impact. Find the service and time window where latency, errors, saturation, or availability changed.
- Traces identify the path. Follow an affected request across service boundaries and locate the slow or failing span.
- Logs explain behavior. Search the trace ID and inspect structured application and dependency errors.
- Events explain orchestration. Check deployments, probe failures, scheduling decisions, and scaling activity around the same window.
The final step is correlation. Shared timestamps help, but stable identifiers and normalized resource attributes make the narrative dependable. Without them, four signals become four versions of the same confusion.
The following video provides another introduction to the signal model and its role in modern observability:
Architecting Instrumentation for Kubernetes
Instrumentation architecture determines both the quality of the data and the load imposed on the application. Kubernetes teams usually choose among application libraries, sidecars, node-level collectors, and kernel-assisted techniques. The correct design is rarely one pattern everywhere.
Compare collection patterns
Application instrumentation gives developers the richest semantic context. Native OpenTelemetry SDKs can record business-relevant spans, propagate trace context, and attach attributes that a proxy can't infer. The trade-off is code ownership and runtime overhead, especially when instrumentation is applied automatically without a clear sampling strategy.
Sidecar containers isolate collection or proxy behavior from the main process and can fit workloads that need a local boundary. They also multiply resource consumers with every pod, complicate scheduling, and make per-workload overhead harder to govern. Sidecars are useful when isolation or protocol handling justifies the cost, but they shouldn't be the default answer for every service.
DaemonSet collectors run once per node and are well suited to node logs, host metrics, and telemetry forwarding. They avoid placing a collector beside every application container, although teams must configure resource limits, capacity planning, and failure handling carefully. A node-level agent also needs reliable metadata enrichment so that ephemeral pod identities remain queryable after rescheduling.
eBPF-based instrumentation can observe kernel and network behavior with limited application changes. It helps platform teams gain low-level visibility across workloads, but it can't replace application-aware spans and business context. Kernel visibility tells you how traffic and processes behave. It doesn't automatically tell you why a checkout operation failed.
The OpenTelemetry instrumentation guidance for Kubernetes is useful when deciding where automatic and manual instrumentation belong.
Put the Collector between code and storage
An OpenTelemetry Collector gateway provides a policy boundary. Applications send telemetry to a controlled endpoint, while the Collector handles batching, retries, filtering, enrichment, sampling, and export routing. That separation keeps application configuration independent from backend choices and gives platform teams one place to enforce telemetry policy.
Use an agent close to the workload when local collection and resilience matter. Use a gateway when central policy, routing, and backend protection matter. Larger environments commonly need both, but the interfaces must remain explicit. Decide which layer owns metadata, sampling, retries, and backpressure before production traffic arrives.
Performance needs measurement rather than assumptions. A 2026 thesis on microservice architectures found CPU overhead reaching 42% under certain OpenTelemetry conditions, with automatic instrumentation roughly doubling CPU overhead compared with manual trace generation. The study also found batching and head-based sampling reduced the performance impact, while metrics instrumentation was cheaper than tracing overall.
A 2025 InfoQ benchmark observed that enabling OpenTelemetry tracing in a high-throughput Go service at 10,000 requests per second increased CPU consumption from 2.0 to 2.7 cores, memory by about 5 to 8 MB, p99 latency from roughly 10 ms to 15 ms, and outbound telemetry traffic to about 4 MB/s. Those results aren't universal capacity estimates, but they show why teams should benchmark representative services with realistic sampling and batching.
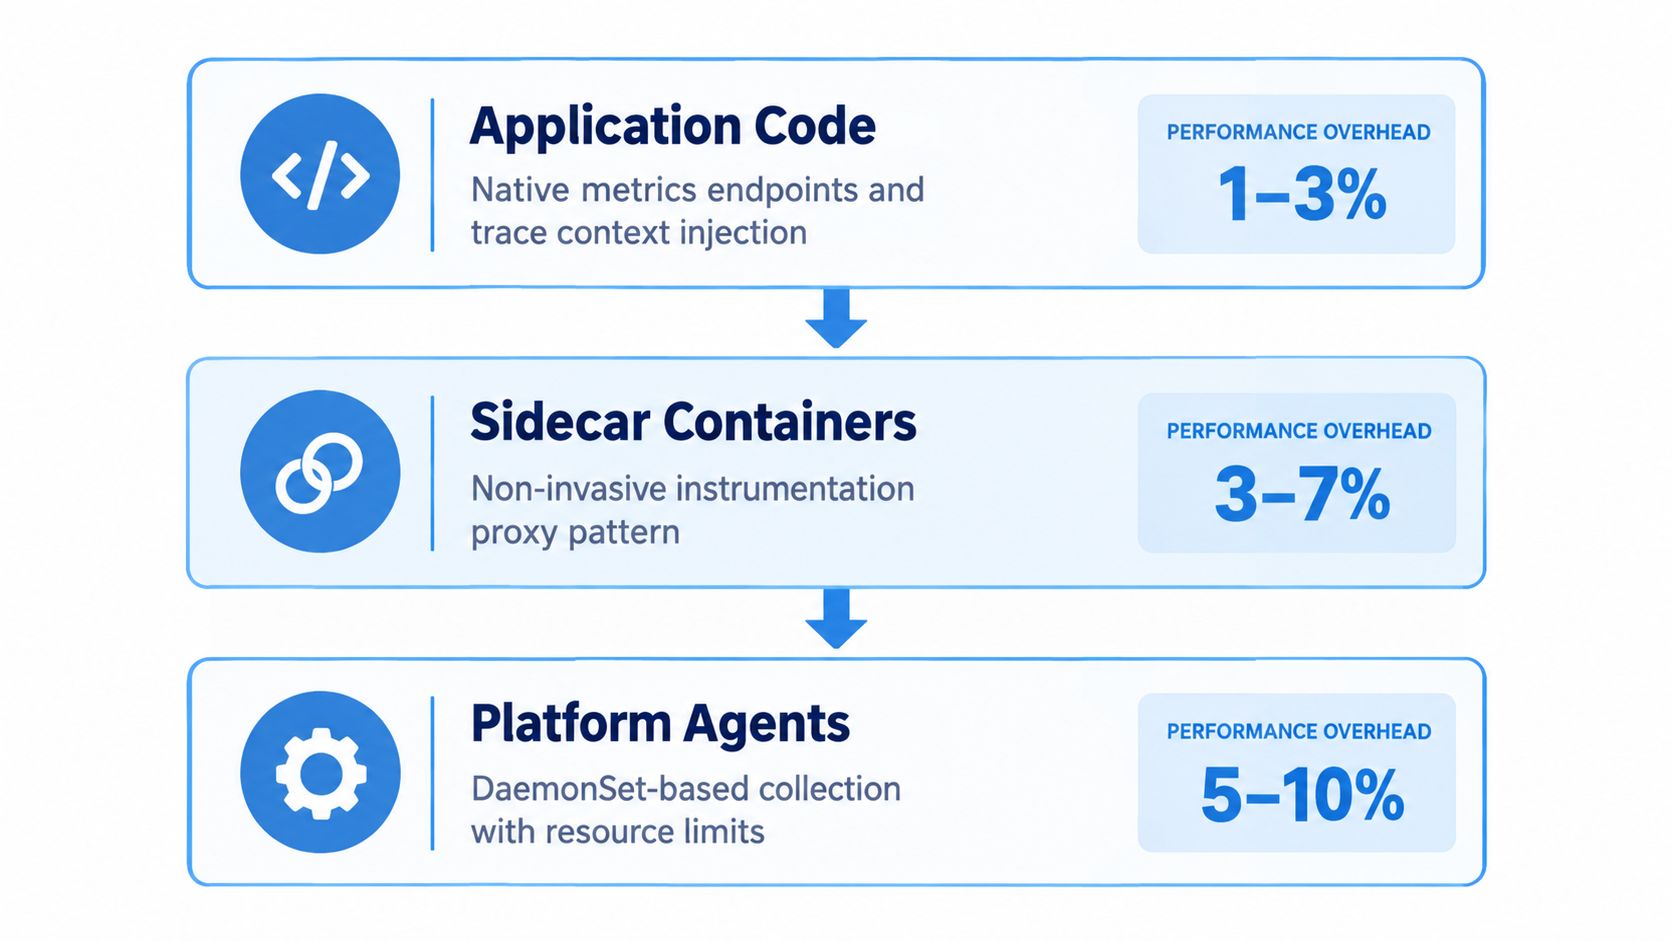
Start with a small set of critical services, define the context every signal must carry, and measure CPU, memory, latency, and network effects before expanding coverage. Instrumentation that destabilizes production is not observability. It's another production dependency.
Building the CNCF Observability Stack
A CNCF-oriented stack works when each component has a clear responsibility. It fails when teams deploy every popular project without defining ownership, retention, query paths, or alert destinations.
| Tool | Primary Signal | Core Function |
|---|---|---|
| Prometheus | Metrics | Scrapes, stores, and evaluates time-series data for dashboards and alerting |
| OpenTelemetry | Metrics, logs, and traces | Provides vendor-neutral instrumentation, collection, processing, and routing |
| Grafana Loki | Logs | Aggregates logs with a label-oriented approach and avoids treating every log field as a full-text index |
| Grafana Tempo | Traces | Stores and queries distributed traces |
| Thanos | Metrics | Extends Prometheus with long-term storage and cross-cluster querying |
Assign one job to each layer
Prometheus remains a strong choice for Kubernetes metrics and rule evaluation. It understands the service discovery patterns that make dynamic workloads manageable and gives teams a familiar model for recording rules and alerts. The practical guide to monitoring Kubernetes with Prometheus can help teams establish that metrics foundation.
Loki is appropriate when the primary need is operational log aggregation and label-based navigation rather than an expansive full-text search index. Teams still need discipline around labels. High-cardinality labels can make a supposedly economical log system difficult to operate.
Tempo focuses on trace storage and exploration. Its value appears when traces connect to metrics and logs through shared service metadata and trace identifiers. A trace backend by itself doesn't create correlation. Instrumentation and dashboard configuration have to supply that relationship.
Thanos addresses a different problem. Prometheus is excellent for local, near-real-time metrics, while multi-cluster environments may need durable retention and a global query view. Thanos can extend the metrics architecture without forcing every query through a single Prometheus instance.
Use OpenTelemetry as the portability layer
OpenTelemetry is the connective tissue, not necessarily the final storage system. SDKs and automatic instrumentation produce signals, and Collectors apply processing and routing before exporting to Prometheus-compatible metrics, Loki, Tempo, or another backend. This lets platform teams change storage or add destinations without rewriting every application integration.
That portability has a practical limit. Semantic conventions, resource attributes, authentication, and ownership still require governance. A pipeline can be technically vendor-neutral while remaining operationally inconsistent.
CloudCops GmbH implements cloud-native observability stacks using OpenTelemetry, Prometheus, Grafana Loki and Tempo, and Thanos where needed, with Kubernetes and GitOps-based provisioning. It can be considered alongside internal platform engineering or other consulting approaches, provided the responsibility for operating the resulting stack stays clear.
The architecture should remain boring at the boundaries. Applications emit standardized telemetry, collectors enforce policy, backends specialize by signal, and Grafana presents the investigation path. Every additional component needs a reason tied to retention, scale, query behavior, or operational ownership.
Mastering Signal Correlation and Alerting
An alert that says “high CPU” may be accurate and still useless during an incident. CPU saturation can result from a retry loop, an inefficient deployment, dependency latency, or legitimate demand. The alert earns its place when it connects infrastructure behavior with a service symptom and gives the responder a clear next action.
Build the investigation path first
Start with identifiers that support reliable navigation. Propagate trace context across HTTP, messaging, and database boundaries. Add trace IDs and span IDs to structured logs. Apply service, namespace, workload, version, and environment attributes consistently across metrics, logs, and traces.
Configure the investigation workflow in the observability interface:
- Metrics to traces: A latency or error panel should open representative traces for the affected service and time range.
- Traces to logs: A selected span should show related application and dependency logs through its trace ID and resource metadata.
- Logs to metrics: Repeated error patterns should show whether the issue is isolated or changing service-level behavior.
- Events to all signals: Deployment, rollout, scaling, and scheduling events should appear beside the application symptoms.
The dashboard product matters less than the navigation contract. During a live incident, an on-call engineer should not copy timestamps, pod names, and request identifiers between separate tools.
Correlation rule: Every signal should answer one of three questions: what is affected, where did the request slow down, or what changed around the failure.
Alert on user impact
Prometheus rules should page only when immediate human action is required. Error rates, latency objectives, unavailable capacity, and failed critical operations generally provide stronger signals than isolated node thresholds. Infrastructure alerts still matter, but many belong in tickets or dashboards unless they threaten service behavior.
A useful alert identifies the affected service, symptom, scope, duration, severity, and the relevant dashboard or runbook. Group related alerts so one dependency failure does not page responders for every downstream symptom. Inhibition rules can suppress child alerts when a confirmed parent incident already explains them.
Alert design requires regular review. Check which pages led to action, which duplicated another alert, and which arrived without enough context. Retire alerts nobody can act on. Add coverage for user-visible failures that infrastructure checks do not detect.
CNCF research identifies dashboard and alert configuration as a significant setup challenge, which matches production experience. Teams often complete telemetry ingestion before defining ownership, escalation paths, and the evidence required to close an incident. Correlation rules and alert routing must be treated as platform policy, not left to individual dashboard authors.
Controlling Telemetry Costs and Sprawl
Telemetry governance should begin before the first large production rollout. Once every request, debug line, and high-cardinality label enters storage, teams become reluctant to remove data because they fear losing forensic coverage. That habit produces a large bill and a noisy investigation surface.
Make retention and sampling deliberate
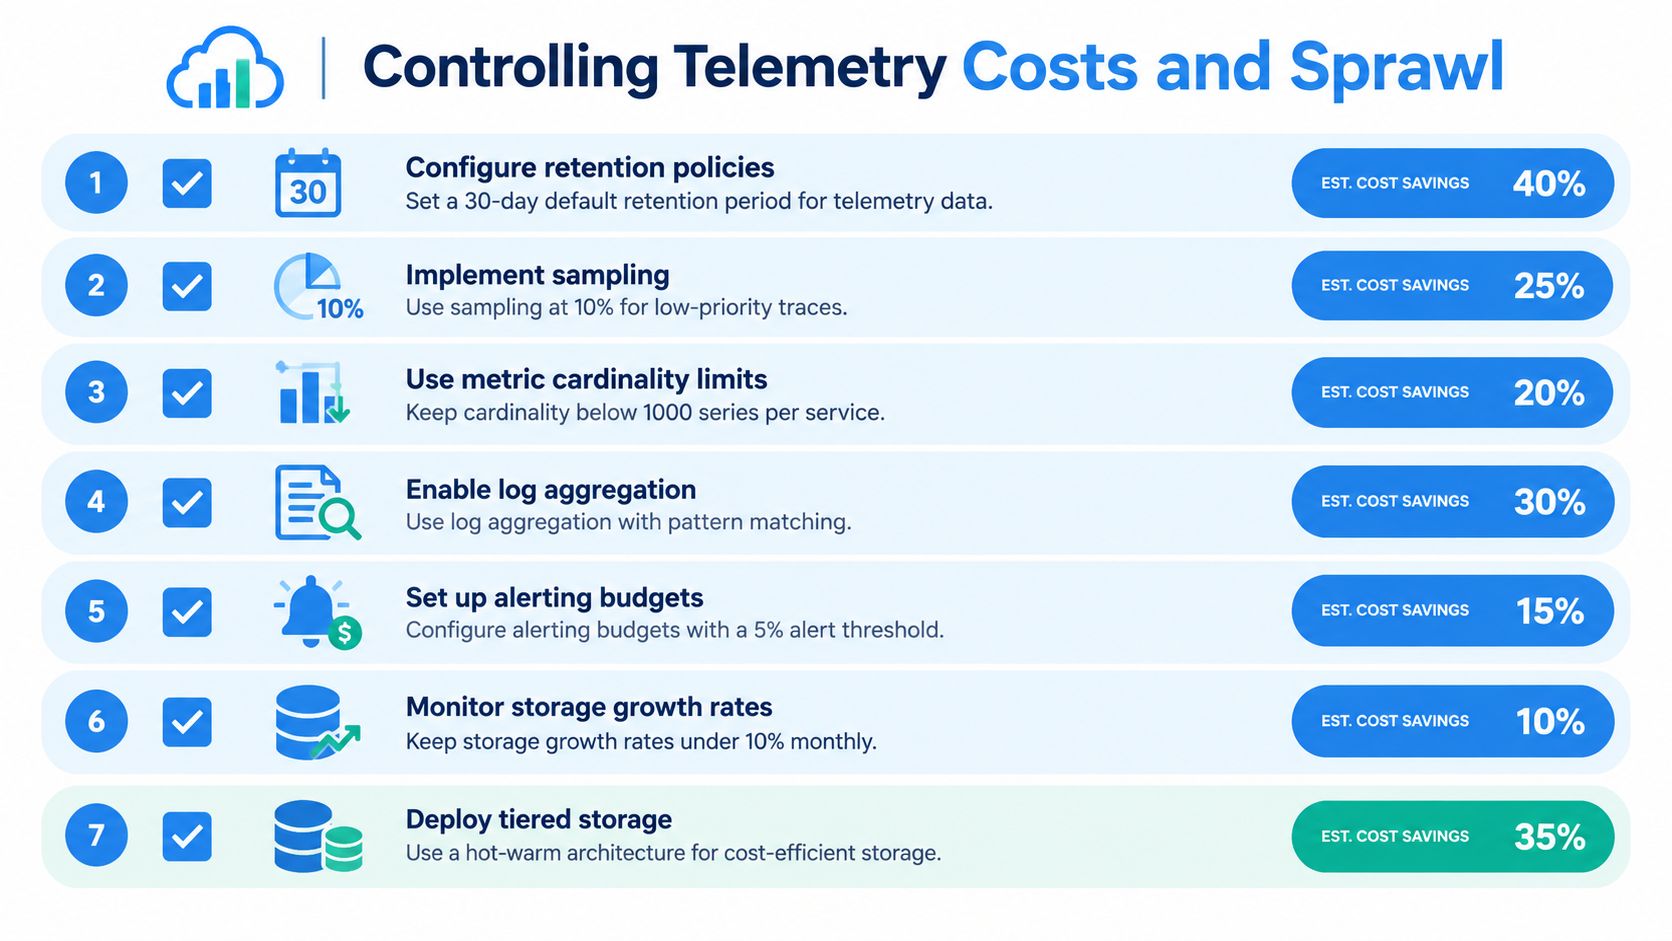
Head-based sampling makes an early decision about whether to retain a trace. It is simple and efficient, but it can discard the exact trace that later proves important. Tail-based sampling waits until the trace is complete, allowing teams to retain errors, slow requests, or unusual paths while dropping routine success traffic. The Collector can support these policies, but tail sampling requires the relevant spans to reach the same decision-making process.
Logs need similar treatment. Keep structured error and audit records that support incident response or compliance. Drop repetitive debug output at the Collector when it has no operational use, and aggregate predictable patterns rather than storing identical low-value records indefinitely.
Metrics require control of label cardinality. A label containing a request ID, user identifier, or unconstrained URL can create an unbounded number of time series. Prefer bounded dimensions such as service, route template, status class, region, and workload, then validate the resulting query behavior.
Measure value, not volume
Cost reviews should ask which signals engineers used during incidents and which records only consumed storage. Break down ingestion, processing, query, and retention costs by team or service. Set ownership for dashboards and alerts, then remove unused assets instead of allowing every group to keep its own copy of the same data.
Elastic's 2026 observability research found that 67% of organizations regularly experience unexpected observability costs or overages. The same research reported that 55% of IT professionals use too many monitoring and observability tools, while 77% lack visibility across on-premises and cloud environments.
Those findings make governance a reliability concern, not merely a finance exercise. SolarWinds' data cited in the same verified research describes an environment where tool quantity and hybrid visibility remain difficult to control. Teams that cannot see where data goes can't make an informed retention or backend decision.
Cost principle: Keep the telemetry that changes an engineering decision. Sample, aggregate, or discard the rest before it reaches expensive storage.
Set retention by investigative value, route high-value data to fast storage, and move historical data to a cheaper tier when query speed isn't required. Review policies after major releases, because a new label or logging change can alter the economics of the entire platform.
Driving Business Outcomes and DORA Metrics
Observability improves delivery only when engineers connect it to decisions made during development and release. A deployment pipeline can be fast, but teams won't use that speed confidently if they can't detect regressions, identify affected services, and restore a safe version quickly.
A practical release workflow starts before deployment. The team defines the service signals that represent success, links dashboards and traces to the release metadata, and prepares rollback conditions. During a progressive rollout, engineers compare error behavior, latency, dependency health, and saturation for the new version against the existing workload. If the evidence shows user impact, GitOps can revert the change through the same auditable path used to deploy it.
From detection to recovery
A unified telemetry path improves Mean Time to Detect by exposing symptoms in the service context where they matter. It improves Mean Time to Resolve when the alert includes the affected route, trace navigation, relevant logs, recent change information, and a clear owner. The benefit doesn't come from a larger dashboard. It comes from removing investigation steps that don't add evidence.
DORA metrics provide a useful operating language for this work. Deployment frequency reflects how often teams can deliver changes safely. Lead time for changes shows how efficiently code moves toward production. Change failure rate reveals whether delivery speed is creating instability. Time to restore service shows how effectively the organization recovers when a release or dependency causes harm.
Observability doesn't improve those measures automatically. Poor alerts can slow recovery, excessive telemetry can obscure the important signal, and inconsistent metadata can leave engineers with attractive but disconnected charts. Mature teams use incident reviews to refine instrumentation, alert thresholds, dashboards, and rollout safeguards together.
Operational outcome: The target isn't a single pane of glass. It's a shorter path from customer symptom to verified cause, safe action, and restored service.
Cloud native observability succeeds when platform engineers treat telemetry as a product with users, budgets, interfaces, and service-level expectations. Start with a critical request path, standardize its context, route it through a governed Collector, and prove that an on-call engineer can investigate a realistic failure without switching blindly between systems.
CloudCops GmbH designs and engineers Kubernetes observability platforms around OpenTelemetry, Prometheus, Grafana Loki and Tempo, and Thanos where the architecture requires it. If you're reducing alert fatigue, consolidating cloud telemetry, or building GitOps-based platform operations, visit CloudCops GmbH to discuss an implementation grounded in measurable operational needs.
Ready to scale your cloud infrastructure?
Let's discuss how CloudCops can help you build secure, scalable, and modern DevOps workflows. Schedule a free discovery call today.
Continue Reading
Root Cause Analysis for DevOps Teams
Master root cause analysis to cut MTTR and boost reliability. Learn proven techniques, workflows, and tools for cloud and DevOps incident response.
ISO 27001 Automation: A Practical Cloud-Native Guide
ISO 27001 Automation. Learn how to automate ISO 27001 in cloud-native environments with policy-as-code, IaC checks, CI/CD evidence, and audit-ready workflows.
Automation ROI Calculation: A Practitioner's Guide
Master automation ROI calculation with a step-by-step methodology for quantifying savings, hidden benefits, and stakeholder-ready presentations.